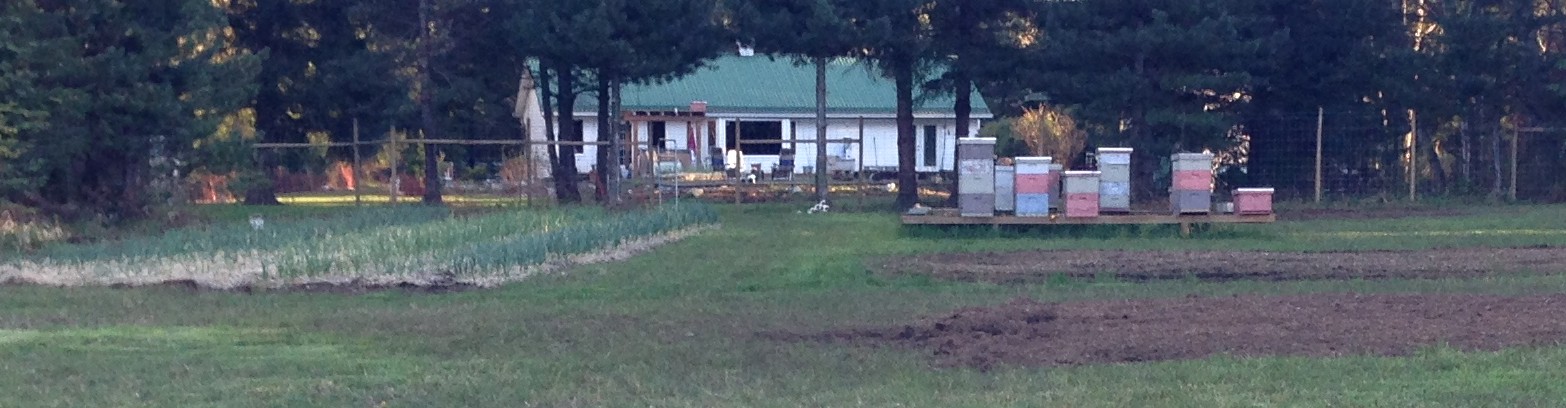
We took half a dozen hives up to the club fireweed yard, it’s a great location with lots of fireweed for the bees to put on nectar. The forest fire hazard went to extreme the day after the hives were moved up, so we didn’t go back and check on them for 3 weeks. When we did go up and check the status of the fireweed bloom 3 weeks later, we realized one of the hives was in poor shape, and a quick look inside made it obvious. The queen didn’t survive the trip up, and they failed to requeen themselves. There wasn’t a lot of bees, and there was no sign of eggs, brood, or a young queen. So we took the hive home. The original plan, after they were in the home yard, install one of the nucs and let them rebuild. The hive had plenty of stores, it just didn’t have enough bees to be productive.
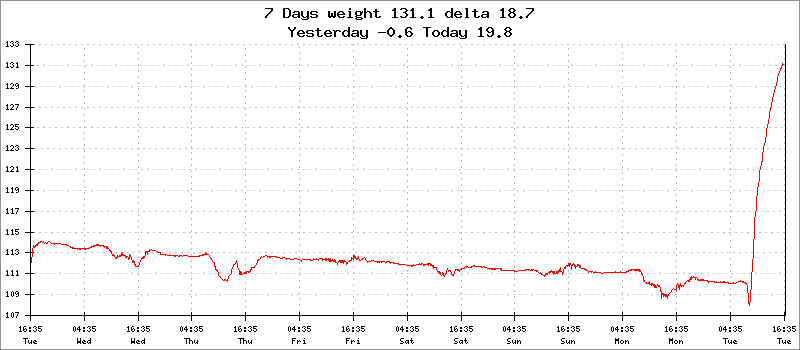
Well the old saying of ‘best laid plans’ came into play. We got them home just before dark and set it on a stand so that a nuc could be merged in later the next day.   By 8am the next morning, there was a frenzy of activity in front of the scale hive, and sure enough, they had already found the weak hive. The robbing frenzy at the weak hive was unstoppable, every hive in the home yard had found a source of easy pickings. The graph tells the story pretty clearly, and by the end of the day, they had pulled 20lb of honey out of the weak hive and taken it home. Click on the graph to see a larger more detailed version.
Robbing season
My best guess after lifting the hive to take it home, there was 60+ pounds of honey and nectar in the hive when we brought it home. After the robbing event, it was essentially ‘licked clean’, not a scrap left. What we were left with was just 20 frames of empty drawn comb, which will now get used to give more drawn frames to the winter nucs. Not exactly what we had planned, but, it’s the choice we have left.
Another graphic lesson which we have saved some scale hive graphs for future reference, this one gives a pretty clear idea of what can happen during a robbing event. In this case, the graph is the home hive of the robbers, but if it was turned around the other way so the hive on the scale was the one being robbed out, it would be equally graphic, just going down instead of up. As time goes on, I’m getting quite a collection of these snapshot graphs that are used in presentations to bee clubs, some of which provide us with new information, and some just re-enforce the things we hear from old time beekeepers.
Another not so obvious lesson from this experience is something I have often wondered about. Reading about folks and the experiences they have with bees, an often mentioned trend is along this line. ‘I have two hives, one is a good producer, and the one beside it doesn’t not produce much honey’. I’ve often wondered if indeed the reality is, both hives produce a similar amount of honey, but one of them is just good at robbing the other. In our second year we had two hives sitting side by side, one produced nearly a hundred pounds of honey while the other was always short. Over the years we have tended to make new queens from that line of bees, and today that’s the line in the scale hive. When we thought we were choosing the best producers, were we in fact choosing the best robbers ? It’s an interesting food for thought question.