Scale graph updates
This morning I spent a bit of time cleaning up graphs for the scale hive. In order to get a better year over year comparison, I added an offset to the 2018 data so that it has a similar starting point to prior years. 2018 data is now a different color from the rest, and the graph is a better year over year comparison as they start at a similar point.
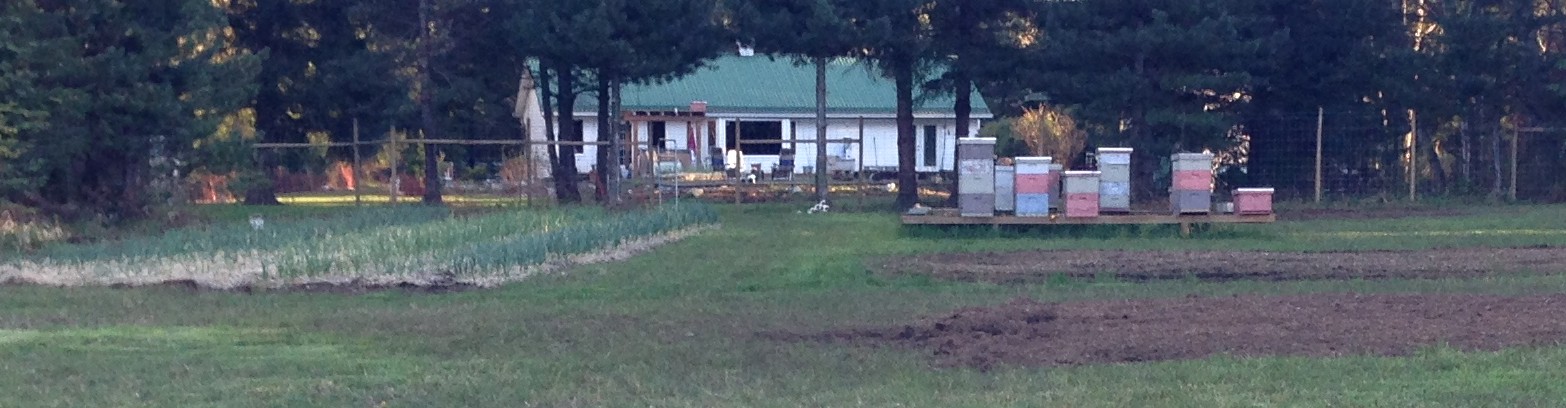
We have had a few problems with this colony this spring. The first issue came about thanks to a 4 legged critter, not completely sure what kind of critter knocked it off the stand on the night of April 24. I suspect it was a small bear as we spotted a bear in the chicken feed next door that evening. It was a little one that scampered up a tree when I went over to lock up chickens for the night. The next morning, hive on the scale was tipped over. That bear was small enough to squeeze under the gate leading into the back lot. We had the hive fully strapped so it didn’t get in, but, the whole hive was laying on it’s side on the ground. On the morning of May 3 we once again found it tipped over, so I set up an electric fence around that stand. All the rest of our hives are strapped to the stands so they cannot be knocked off, but I cant do that with the hive on the scale and still get proper weight data, so another fence was the only option left.
Considering how badly this colony has been disrupted thru the spring, it’s been doing well. I added another empty drawn super yesterday because all of the supers that were on top were heavy with nectar. Currently configured with a double deep for the brood nest and 4 drawn supers above an excluder. Historical data shows we should have a considerable flow running for at least another two weeks, the thimbleberries have started to bloom and after thimbles we expect raspberries to start blooming.