Colony growth – putting it all together
The colony growth model is now more or less complete, I have worked up the math for how a bee population can progress thru the season, as well as the math for varroa mite populations. You can read about the details behind the math here.
So the next question, how realistic is this model, ie, does it truely represent what we see out here in the real world. The proof is in the pudding so to speak, so lets walk thru an example which is VERY typical of what we see happen with new beekeepers in our area, particularly those with an inclination toward ‘natural beekeeping’, ie, no management of varroa.
A very typical start is easy to set up. Open the colony growth model in a new tab with this link. Set the start conditions to a typical new start for our area, a 4 frame nuc started on May 15, queen starts to slow down on Sept 1 and the bees will start evicting the drones by Sept 15. The lines will show a very typical colony growth trajectory that ends with roughly 9 frames of bees for the winter cluster. Now lets assume this colony is very isolated, and catches no mites thru drift, but, it arrived with 1 mite, so select 1 mite in the starting mite population. The end result has virtually no impact on the overall colony, which will end the season with 9 frames of bees, and a 0.6% mite load with a total of 172 mites. This looks like a healthy productive colony of bees, and it’s easy now to start thinking ‘I have no mites, never saw any mites, and the bees look good without any form of treatment, I have good bees that deal with mites’. this is a strong colony with a great looking population of healthy winter bees.
So now lets follow this colony into it’s second season. Start conditions for season 2 will be 9 frames of bees in a wintered unit that starts brooding on March 1. As you can immediately see, the colony grows to the same strength is did the year prior, but gets there earlier in the season. This is an expected difference, with a larger starting population we can expect the initial brood cycles to produce more brood. But there is yet a hidden gotcha, the starting mite population is still set to one mite, and if we look at the results from the end of last year, the colony went into winter with 172 mites. Lets assume a big chunk of the mites didn’t survive the winter, so set the starting mite population to 100 mites to account for almost half of them not surviving the winter.
Now look carefully at that graph of the colony that started the year as a healthy strong colony, 9 frames of bees to begin the season, but they had 100 mites at the start too. Right around Sept 1 you see the mite population is greater than the brood population, which means virtually EVERY brood cell will be infested with a varroa mite. Those are the brood that _should_ be making up the healthy winter bee population, but, they are now emerging as sick bees infested with mite vectored virus. From the outside, this colony doesn’t look to bad in the Sept 1 timeframe, still a healthy batch of foragers coming and going, they made a decent honey crop because there was a good forager population during the honey flow, but the exploding mite population has decimated this colony. By the time they are finished brooding, there isn’t a healthy bee left in the colony, and by the mid November to early December timeframe, there are virtually no bees left.
This mirrors almost exactly what we see over and over. Somebody new to bees starts a colony and doesn’t seem to have a problem with mites in the first year, so they erroneously come to the conclusion ‘I have good bees, they deal with mites fine without a beekeeper intervention’. thru the second year they smugly pay lip service to the old timers saying ‘you need to manage varroa mites’ because, they know, those bees did fine last year with no management. And then by November we see postings on various online sites saying ‘My bees just absconded, why would they do that so late in the season?’. The answer is, they did not abscond, they died. What happened was, that varroa population was growing exponentially thru the season, and then when the time came for the bees to start raising long lived winter bees to carry the population thru the upcoming winter, they were only raising sick bees totally infested with varroa mites in the cells while developing.
So, armed with the knowledge of what happens later in the season in your colony that starts out with 100 mites, the beauty of having a model, we can experiment with options and play the ‘what if’ game. The exercise at this point then, can you find a series of treatment options that will allow your colony started with 100 mites to end the season with a healthy population of winter bees, and 200 or less mites. With the formic acid flash and OAV in your mite control toolbox, the answer is yes you can, but, it will take no less than 8 applications of OAV to keep this colony as healthy at the end of the season as it was at the start.
The real answer to mite control, start the season with fewer mites.
 The theory behind this unit is fairly simple. If we have a scale under the back side of the hive, and a 2×4 pry under the front to keep it level, the scale should be registering roughly half of the hive weight. The theory is sound, and if you are just after accurate approximations of hive progress during a flow, the Broodminder scale ‘out of the box’ is more than sufficient. If you want science grade data from the unit, that too is fairly easy to accomplish, just buy two and use a second scale instead of a 2×4 pry under the other end of the hive, then add the two weights together. I haven’t started to investigate temperature corrections yet, but it shouldn’t be difficult. With temp corrections applied for the load cells, graphs from this unit should indeed be as smooth as they are from the original scale which does have temperature corrections applied to it’s data.
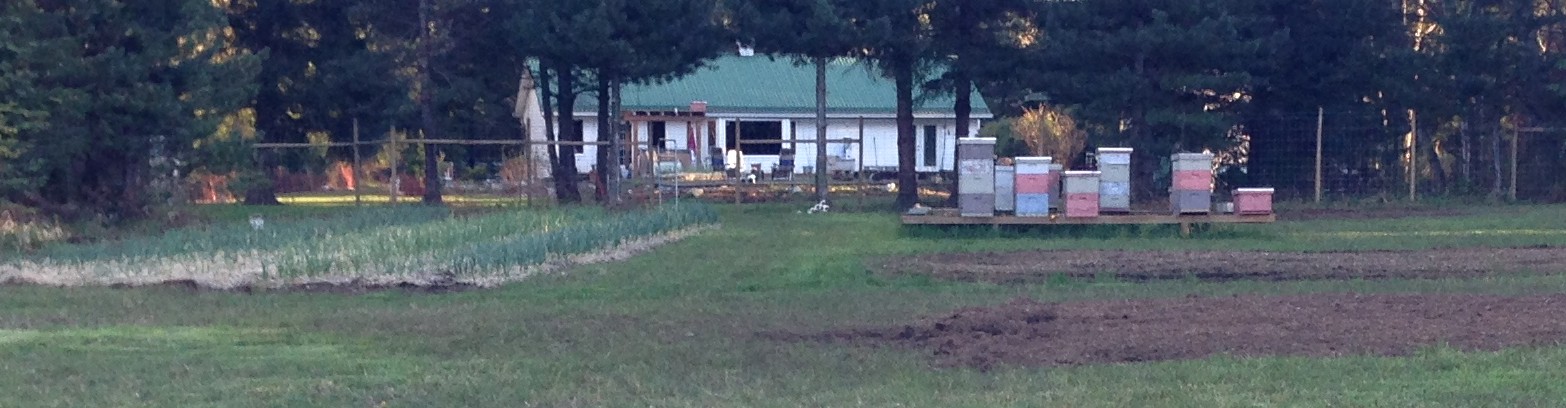
When we first set up the hive scale, the original intent was to get an accurate understanding of the flows in our new area after we bought this property and started turning it into Rozehaven Farm. For that purpose, getting to understand the specifics of flows in any given location, this scale is more than adaquate. We track the dates when we see various blooms, and correlate that with data from the scale. This data set allows us to better understand which blooms produce the nectar that turns into honey in our colonies. When we first moved here, the mantra on this part of the island was ‘blackberries are the main flow’. Today, I dont agree with that older mantra, and we have hard data to back it up. Over 3 years of data collection, our hives on the lot here have never gained any significant weight over the blackberry flow. The early honey comes from the series of blooms that preceed the blackberry bloom, and in our case, the start of the blackberry bloom is now our cue to remove honey supers and extract the early honey. We take the time after pulling supers to prepare our colonies for the move up to Fireweed.
For somebody interested in honey production, I think the Broodminder scale can be an invaluable asset in evaluating yard locations. It’s fully self contained and requires no outside infrastructure to use. Simply place a colony at a new location, set the Broodminder scale under it, then collect your data later using your phone. You will get a nice pretty graph showing exactly when the colony was bringing in enough surplus nectar to store it as honey. We are considering a couple of new outyards as we slowly expand our bee operation, and I think those locations will get a colony this summer that is sitting on a Broodminder scale to give us a detailed record of how well each location can do in terms of honey production over the season, and help us with learning to better time hive placement for catching flows.
The theory behind this unit is fairly simple. If we have a scale under the back side of the hive, and a 2×4 pry under the front to keep it level, the scale should be registering roughly half of the hive weight. The theory is sound, and if you are just after accurate approximations of hive progress during a flow, the Broodminder scale ‘out of the box’ is more than sufficient. If you want science grade data from the unit, that too is fairly easy to accomplish, just buy two and use a second scale instead of a 2×4 pry under the other end of the hive, then add the two weights together. I haven’t started to investigate temperature corrections yet, but it shouldn’t be difficult. With temp corrections applied for the load cells, graphs from this unit should indeed be as smooth as they are from the original scale which does have temperature corrections applied to it’s data.
When we first set up the hive scale, the original intent was to get an accurate understanding of the flows in our new area after we bought this property and started turning it into Rozehaven Farm. For that purpose, getting to understand the specifics of flows in any given location, this scale is more than adaquate. We track the dates when we see various blooms, and correlate that with data from the scale. This data set allows us to better understand which blooms produce the nectar that turns into honey in our colonies. When we first moved here, the mantra on this part of the island was ‘blackberries are the main flow’. Today, I dont agree with that older mantra, and we have hard data to back it up. Over 3 years of data collection, our hives on the lot here have never gained any significant weight over the blackberry flow. The early honey comes from the series of blooms that preceed the blackberry bloom, and in our case, the start of the blackberry bloom is now our cue to remove honey supers and extract the early honey. We take the time after pulling supers to prepare our colonies for the move up to Fireweed.
For somebody interested in honey production, I think the Broodminder scale can be an invaluable asset in evaluating yard locations. It’s fully self contained and requires no outside infrastructure to use. Simply place a colony at a new location, set the Broodminder scale under it, then collect your data later using your phone. You will get a nice pretty graph showing exactly when the colony was bringing in enough surplus nectar to store it as honey. We are considering a couple of new outyards as we slowly expand our bee operation, and I think those locations will get a colony this summer that is sitting on a Broodminder scale to give us a detailed record of how well each location can do in terms of honey production over the season, and help us with learning to better time hive placement for catching flows.