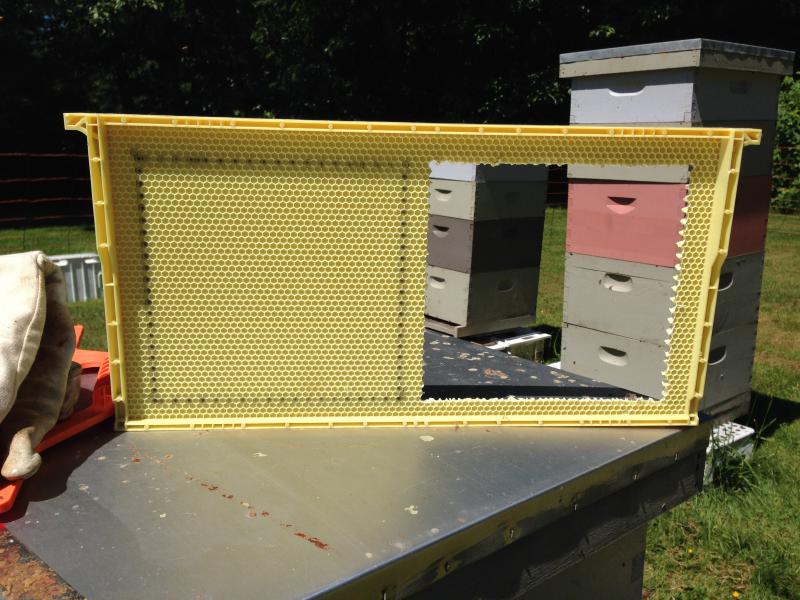
A few years ago I was intrigued by much of the chatter online regarding various ways and means of co-ercing the bees to build more comb, faster. One premise that I read over and over, bees will build foundationless faster than building on foundation, and they will only build comb on plastic if absolutely forced. I did a very crude little experiment to test this hypothesis for myself. Granted, my experiment was not statistically significant, N=1 is not a valid statistical set, but, this was rather enlightening for me. My method was simple, very simple, present the bees with the foundationless, and plastic foundation, on the same frame. The test setup

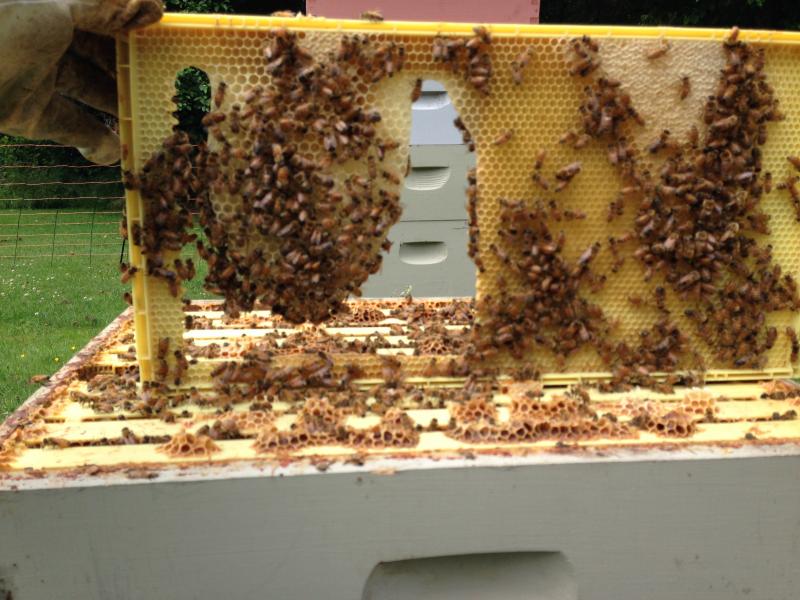
Some time later, we removed the frame from the hive and took a photo.

A quick measurement of how much comb we found in the empty space, and how much was on the plastic foundation gave me the answer I was looking for, and that answer was, no appreciable difference between the two halves of this frame, placed in this hive.
This last weekend we attended the BCHPA annual meeting and the associated education days. One of the sessions I sat in on was a presentation by Randy Oliver describing the correct way to go about a real ‘experiment’ and produce acceptable valid conclusions. My simple comb building experiment was essentially ‘all wrong’, about the only thing right with this one, indeed there was a test case, and a control, subject to identical conditions. That part was easy, the test and control were both on the same frame, placed in the same hive. the result isn’t truely valid because we had only one frame in one hive, so, no other hives replicating this result, and N=1 is not a valid statistical answer. But I also learned, this would be a relatively strait forward experiment to repeat, but, in a more formal manner to produce a result that would be accepted as a real ‘practical research result’.
For those that know me, they know I am big on doing applied research to get practical results that have implications for our business. Next season, during the main flow, we will have more than enough colonies building in 4 over 4 nucleus configurations to repeat this experiment in a manner that can generate a statistically significant result.
The question we asked before, will bees build more comb in a foundationless frame than on a frame with plastic foundation? Randy would say, the correct answer is ‘I dont know’, because we dont have data to show a definitive answer. I have _some_ data, but not enough to be definitive, so I’ll qualify my answer as ‘I dont think so’, but now I’m a bit inspired to produce a real answer, and this is a real answer that’s easily within reach. I’ve got 6 months to write up a proper experiment protocol which can be executed next season during our spring flow, and produce a real answer to this question.
This is going to be fun….
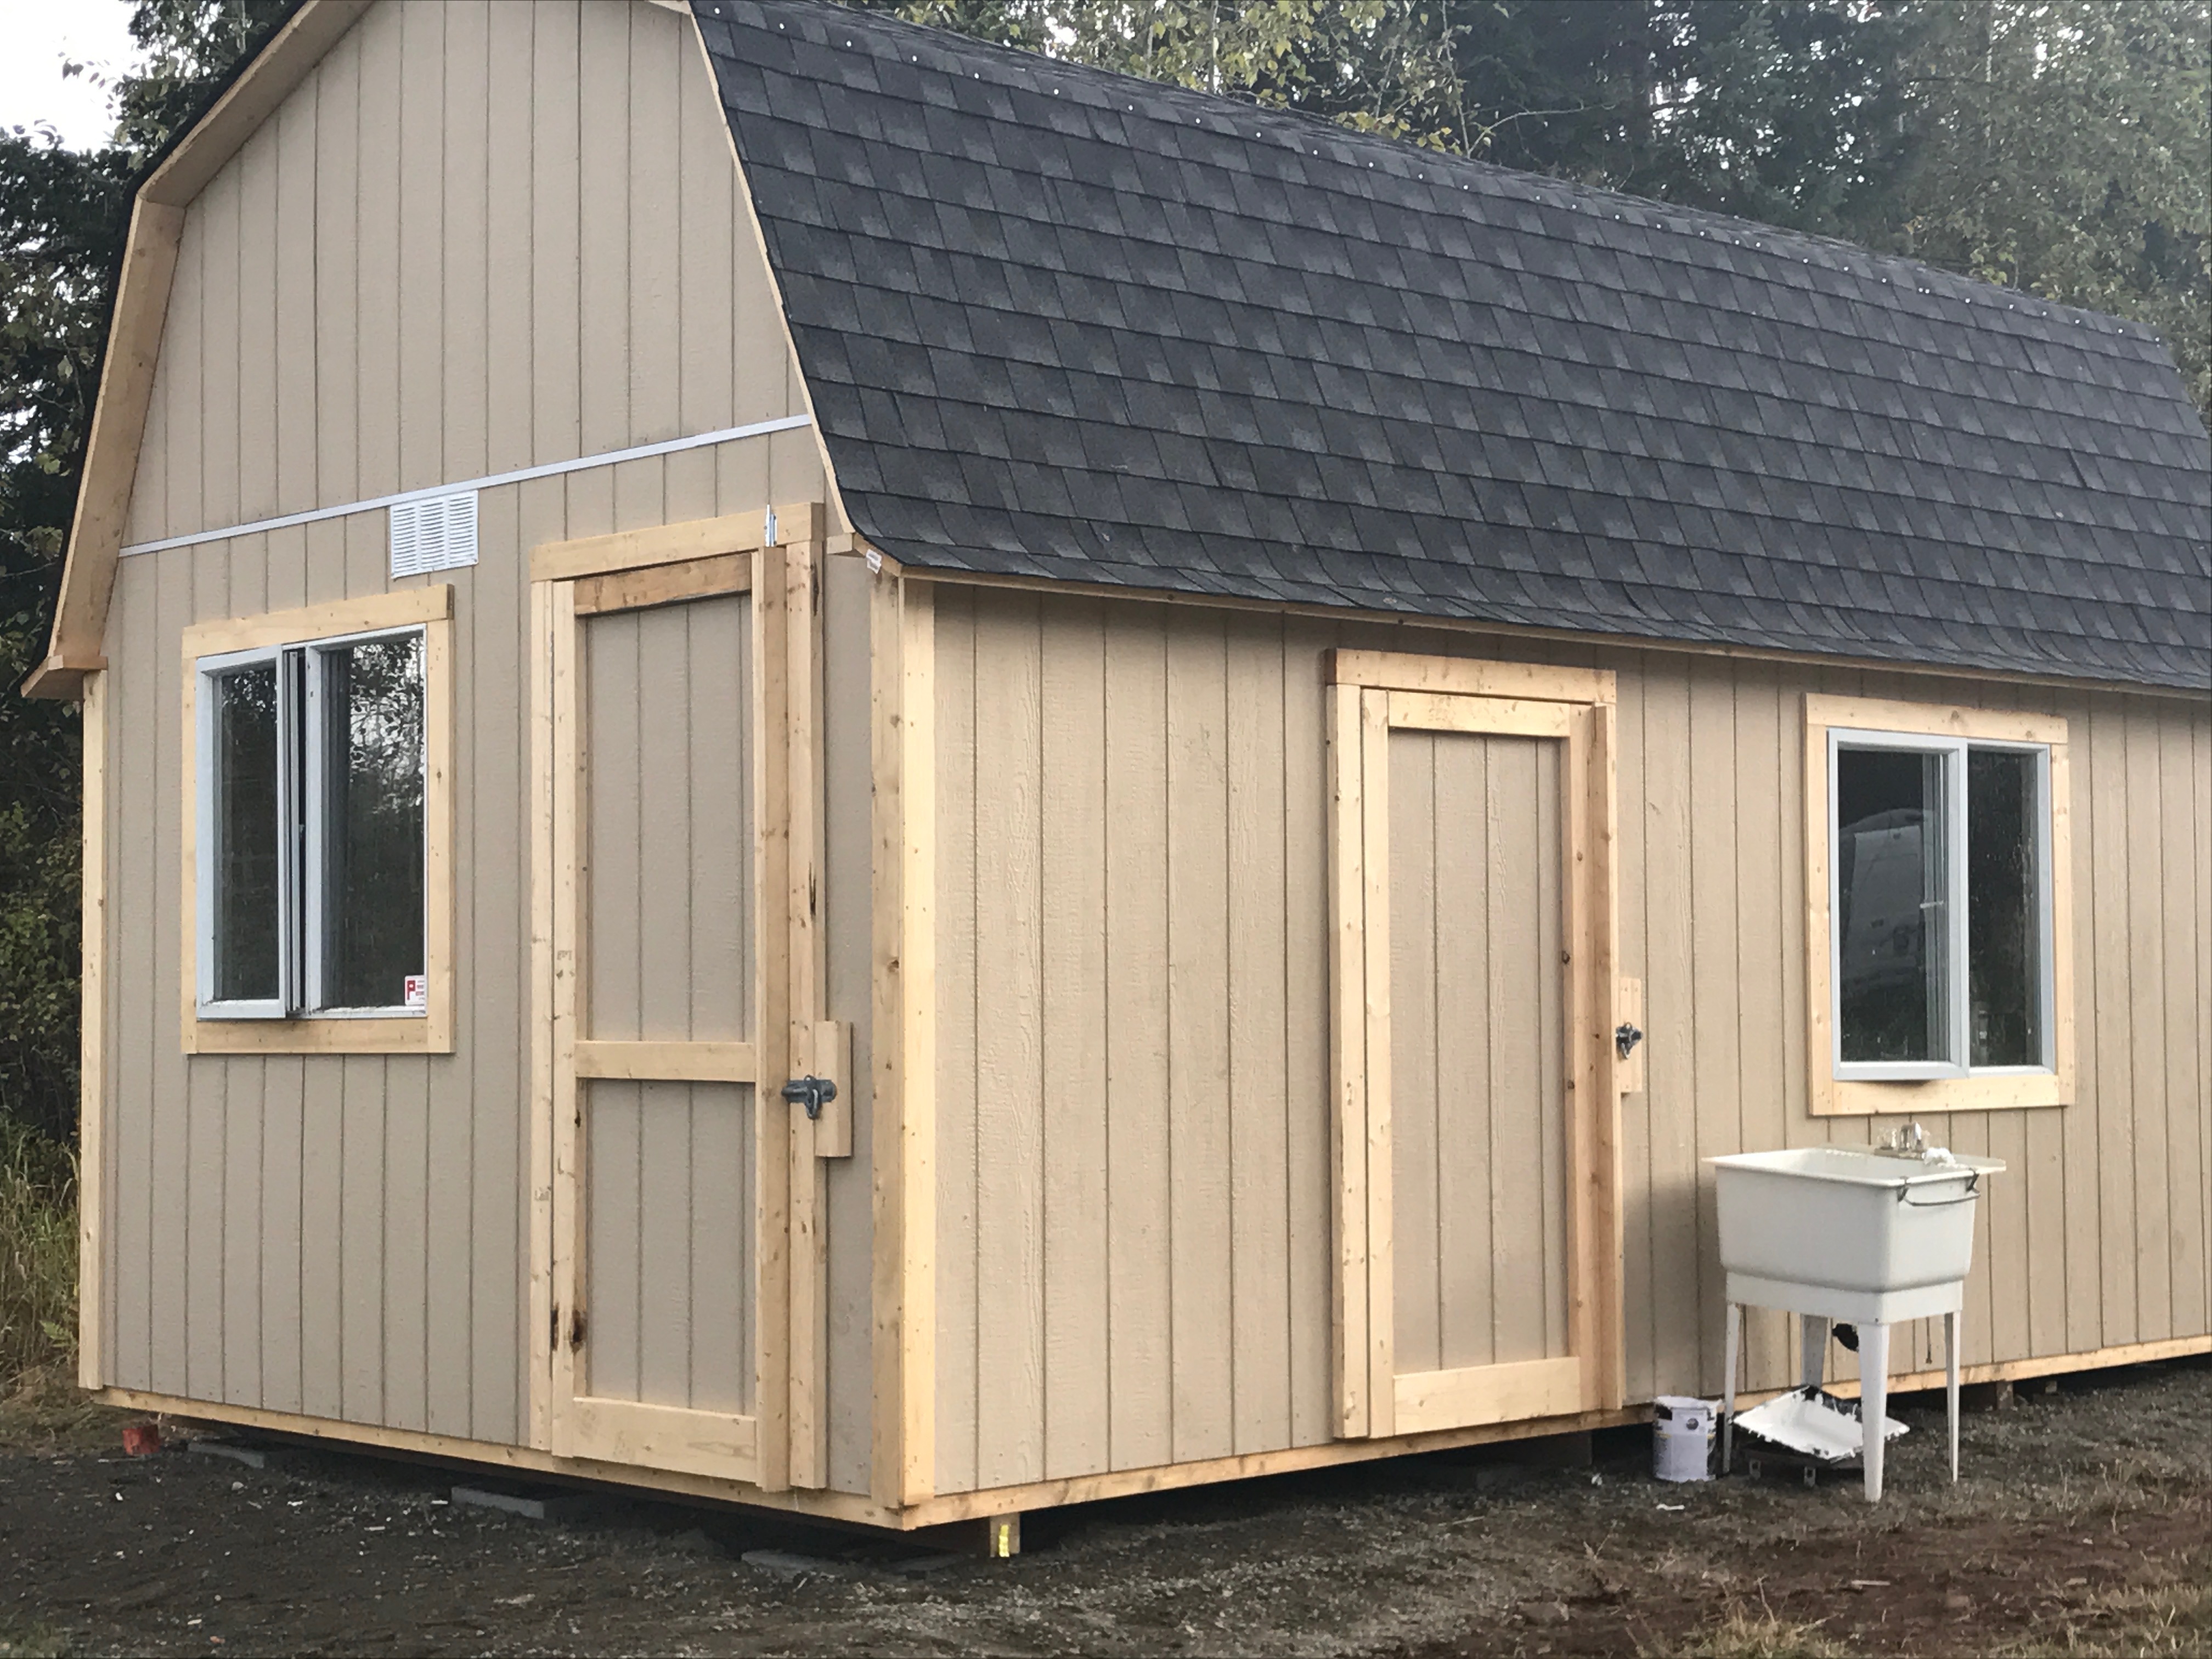
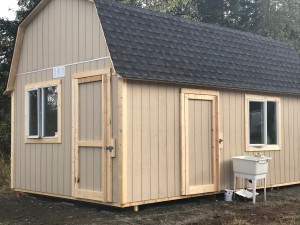
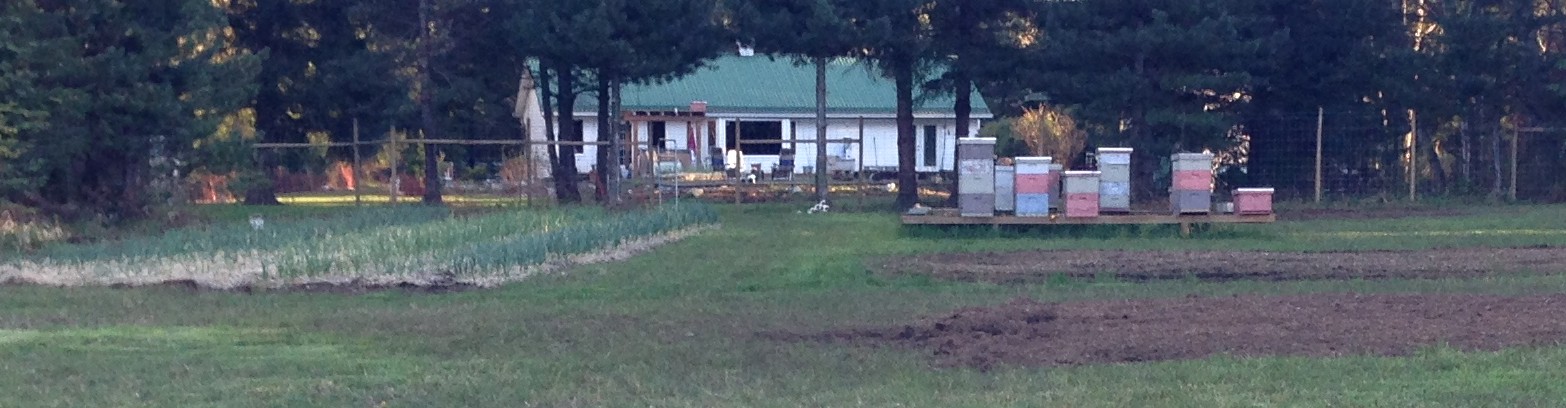
When we bought this property in 2013, we set out a fairly extensive list of improvements to add over time. One of the larger items, and the last item on that list, was building a place to process honey and store bee equipment, we want to free up the garage for use as a garage.
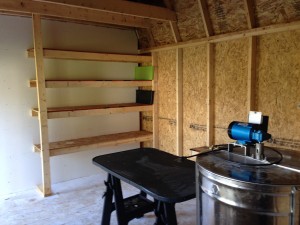
Over the last two weeks, the project has been underway, and is now complete. The structure is 12×20 with a 4×12 section on one end carved out by an interior partition to be used as a warm room during the honey extraction process. The work area is 12×15 and will have the extractor permanently mounted, along with the bottling table and storage for all the relevant equipment. The building is finished, and over the next couple of weeks we will tackle the job of moving all the bee equipment from the garage into the honey house.
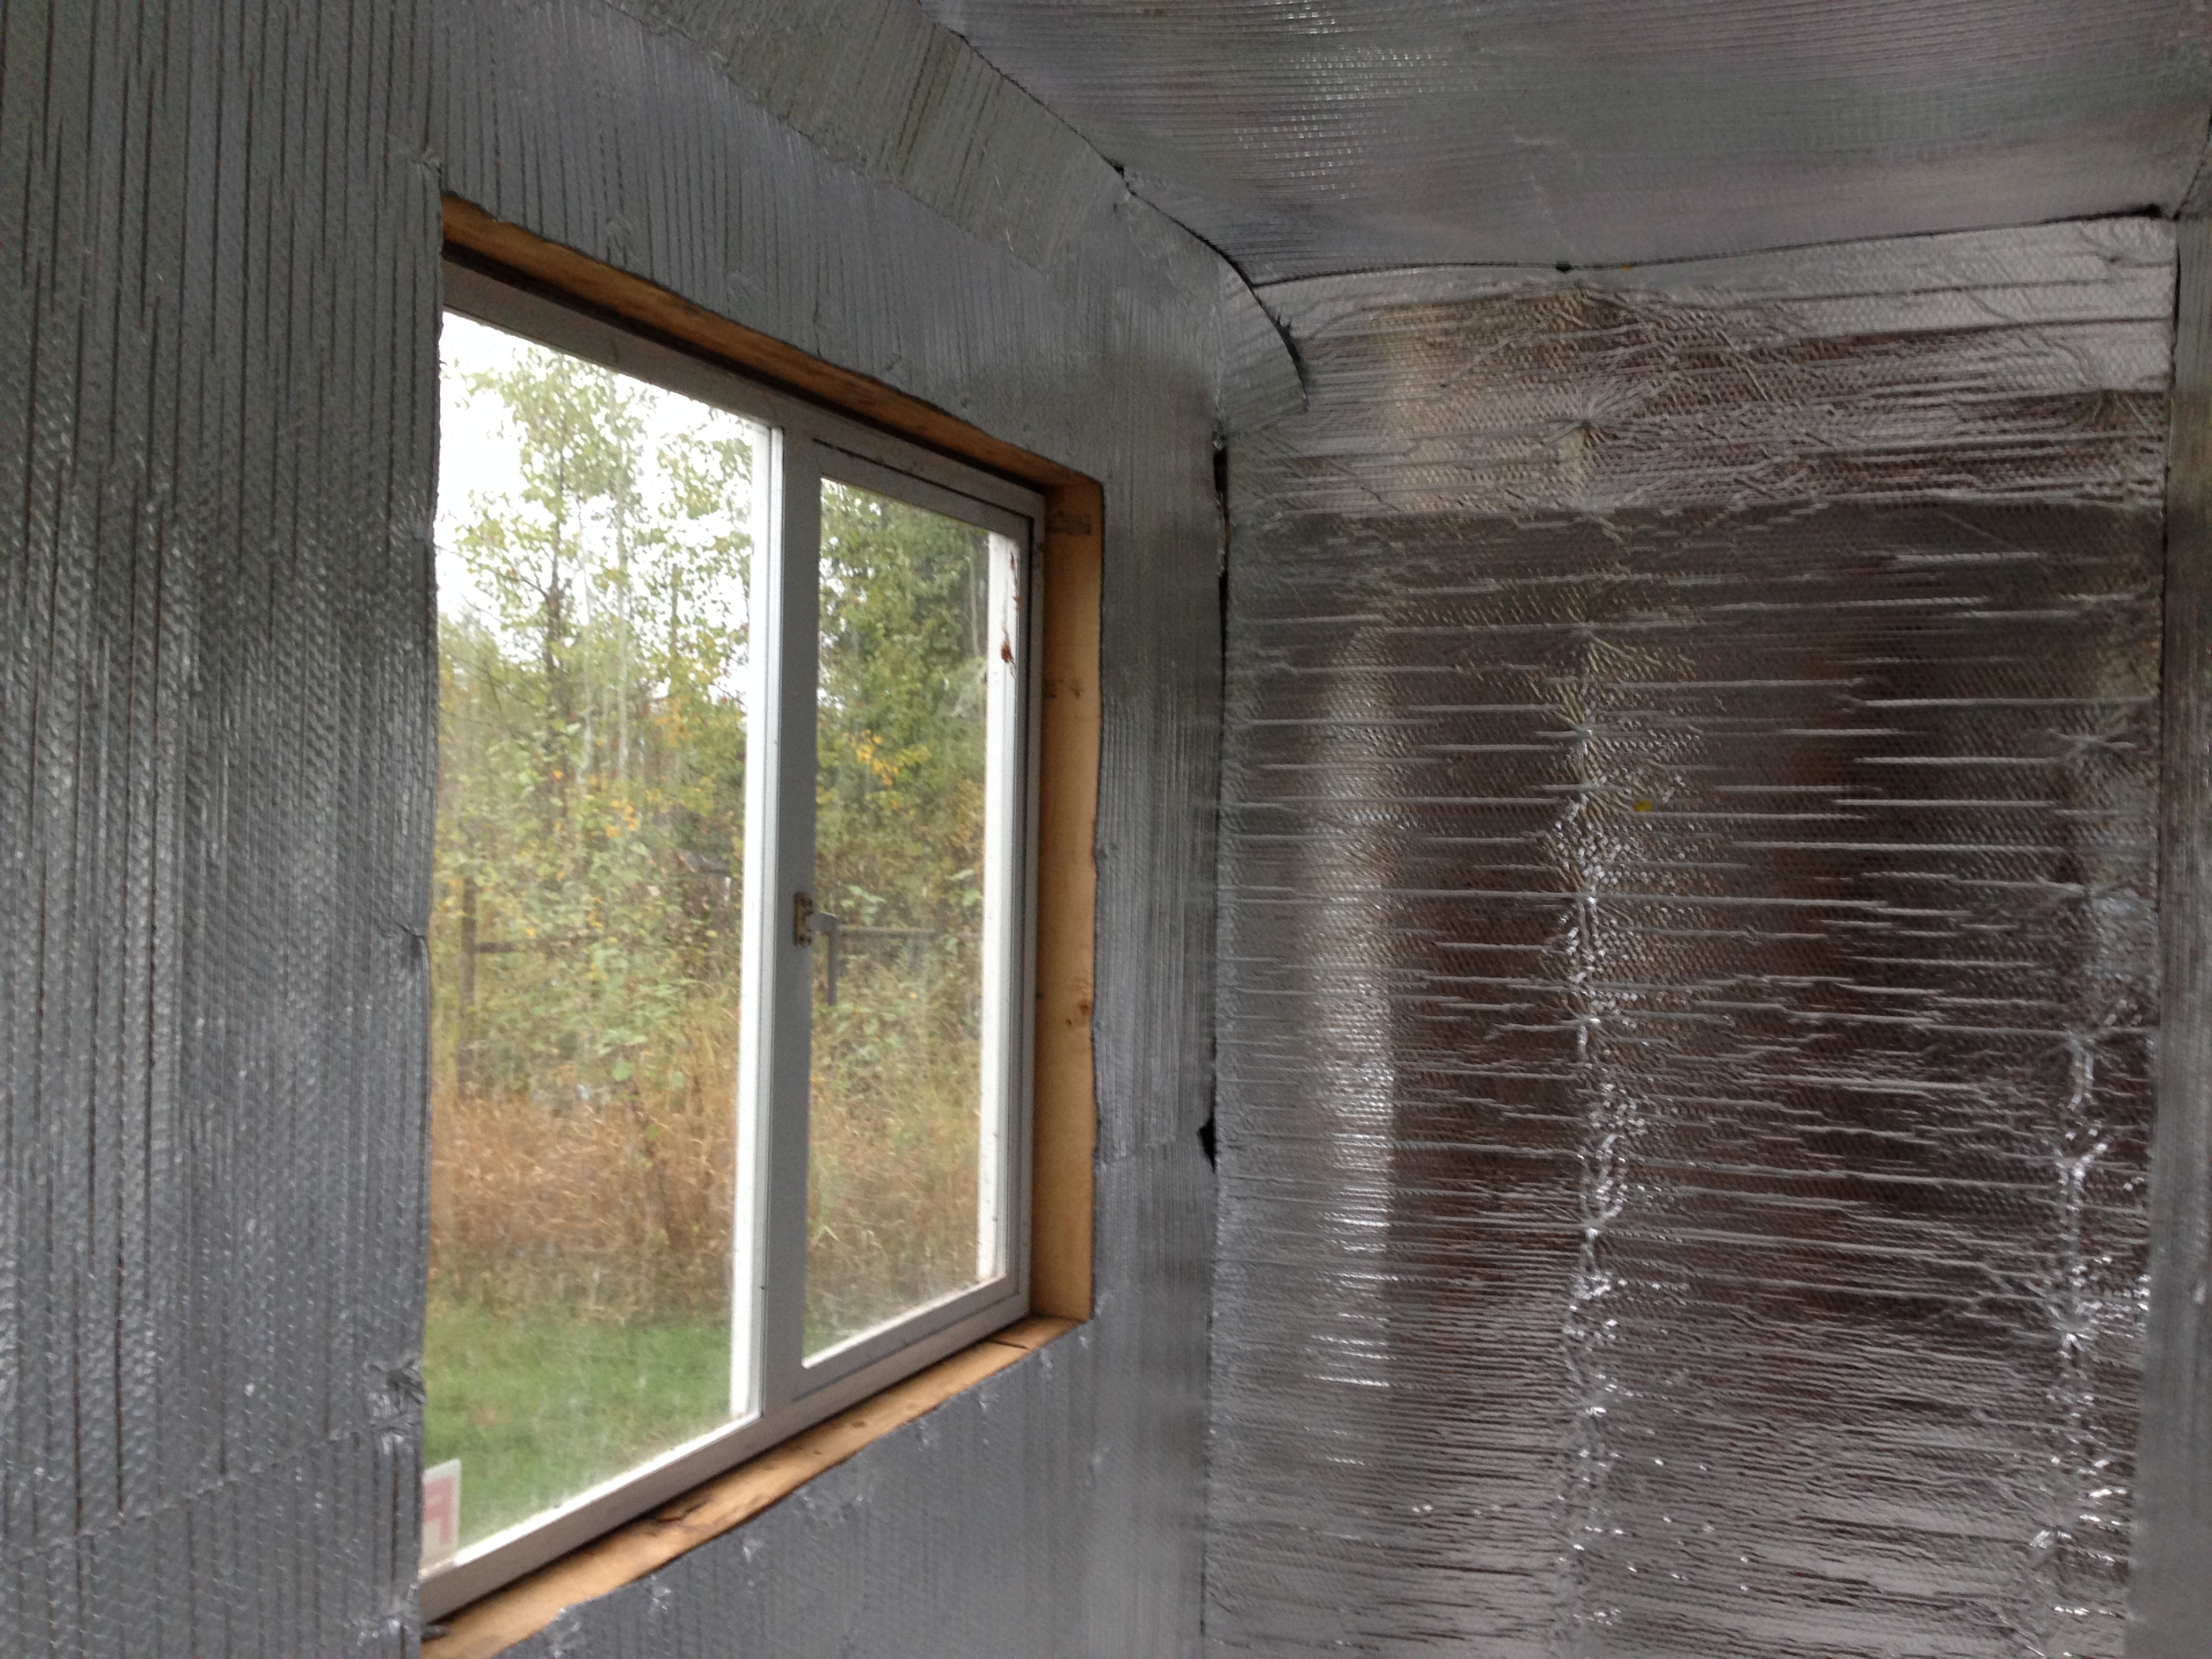
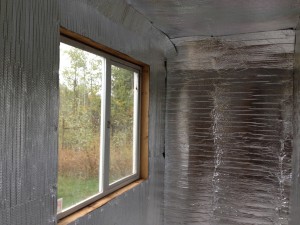
It was raining on Saturday, so we did spend most of the day on ‘inside work’, one of those tasks was to insulate the warm room (closet) in the honey house. The building is 2×4 framing, so we put fiberglass insulation between the studs, then stapled reflectex over that to contain the fiberglass and add another R3 of insulation value to the room as a whole. Based on how well the room heated up with two of us working in there after the fiberglass was in, and we were busy putting on the reflectex, it wont take much heat to keep it at a temperature suitable for storing honey boxes waiting on extraction.
The whole build was sized around a ‘serious sideline’ bee endeavor. The warm room can hold 50 medium supers stacked 5 high, which means no lifting of heavy supers up over shoulder height. With the Mann Lake 9/18 extractor, 50 supers is 25 loads in the extractor, so roughly 5 to 6 hours of extracting. A honey pull from 25 hives with 2 supers on each turns into a weekend project, extract on Saturday and we can bottle on Sunday, with an expected yield of between 1000 and 1500 pounds of honey in bottles after weekend of processing. We usually have two of us working when extracting honey, but the setup in this facility will be laid out so it can be a one person job, uncapping the next load of frames while a load spins in the extractor. No more storing honey in 5 gallon buckets till we can get around to setting up for bottling, it’ll always be ready.
For winter storage, the warm closet has enough room to squeeze in 150 supers stacked floor to ceiling. This will be sufficient for us for the next few years.
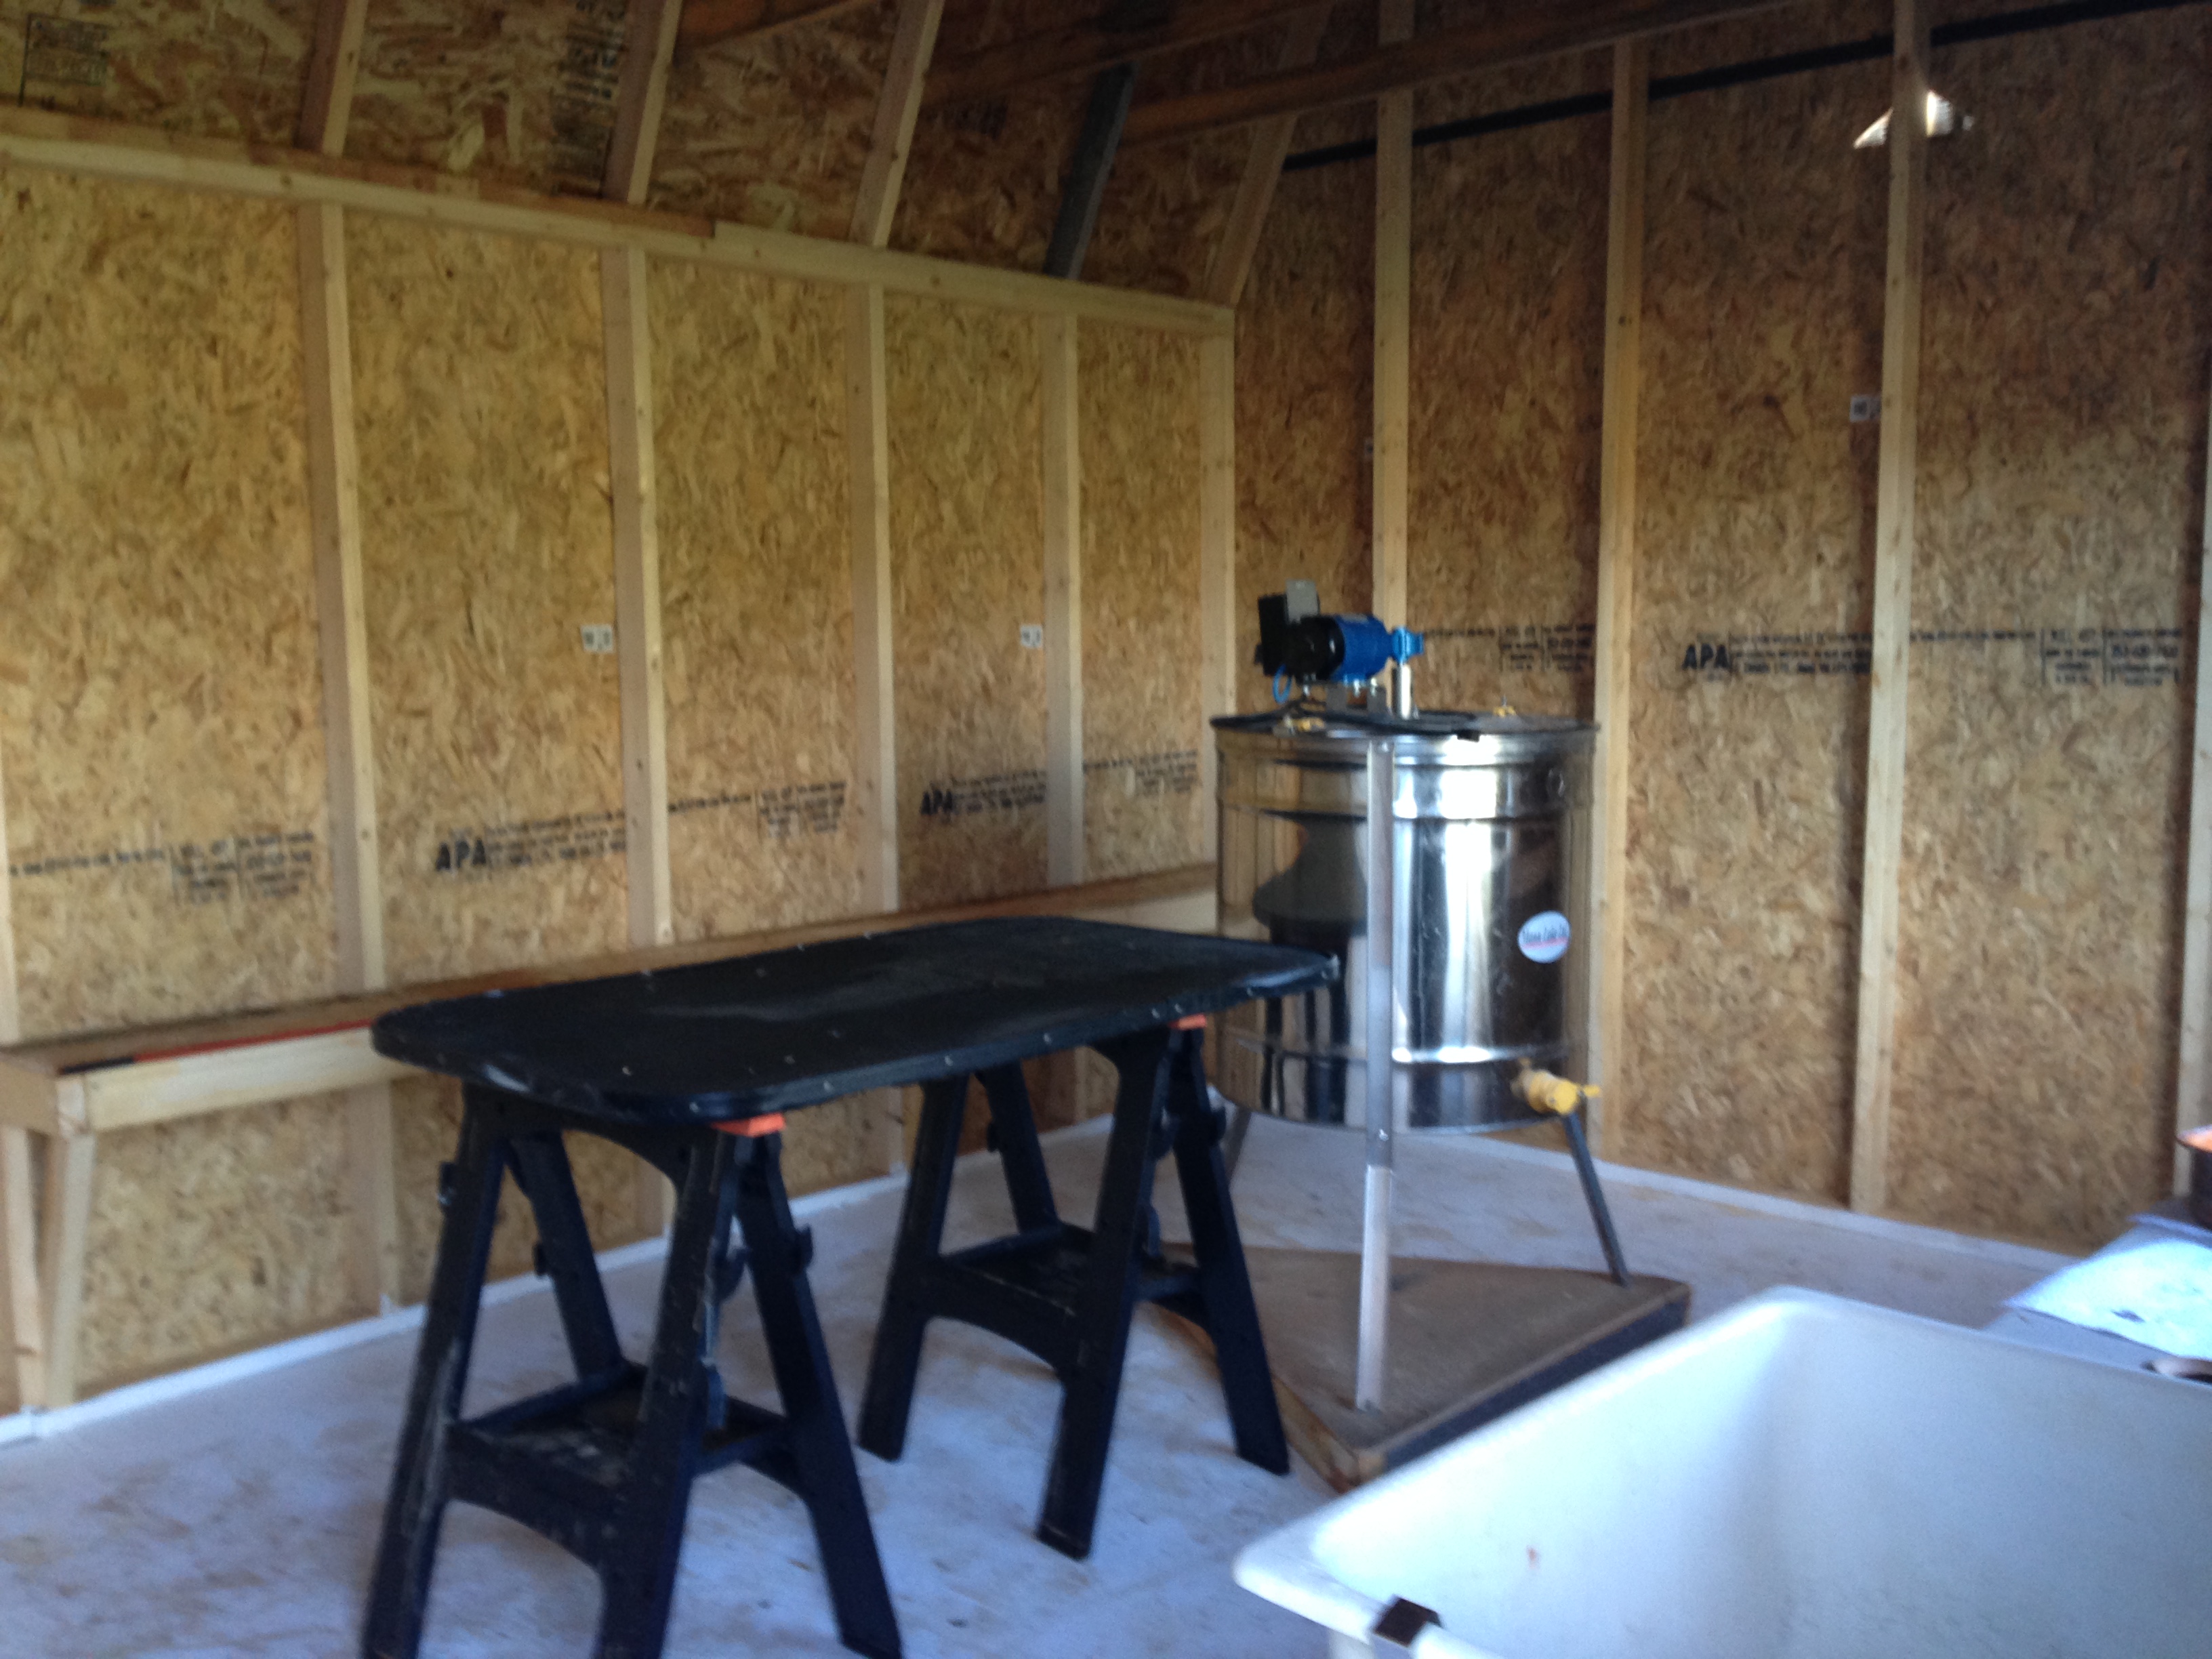
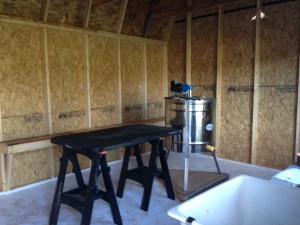
The interior of the main work room is set up with the washtub, extractor permanently mounted, the bottling table set up under the window, and shelving for equipment storage on the other walls.
Last fall we were intrigued by the simplicity of the hive scale system from the folks at BroodMinder. I ordered one of the scales and a couple of the hive temperature and humidity monitors. Initially there were some problems with battery life, and I set the project on the shelf for the winter, didn’t want to be opening a colony weekly all winter to change batteries in the temp monitor. Last month I dug all that stuff out again when Jeff Lee from the BCHPA stopped by for an afternoon, and it left me inspired to finish setting up and starting a serious evaluation of the gadgets.
My conclusion now, the battery issues I had were just one defective unit, the other two units ran fine all winter stuffed in the closet. The scale went under a hive beside the already existing hive scale, and the temp / humidity gadget is now in the hive that has had a scale for years.
The Broodminder scale is a relatively simple gadget, lots of information at the
Broodminder website. It is essentially a bar scale with two load sensors packaged up in a form factor similar in size to a 2×4. To use it, cut a piece of 2×4 to the width of the hive, and set that under the front or back of the hive, then set the scale under the other end. The easiest way to retrieve data from the unit is to simply walk up to it and use a smartphone with bluetooth.
For our installation I wanted live data coming to the website the same way the other scale works, so ofc I did not go the easy route for fetching data from these units. I put together a raspberry pi computer with bluetooth and set it beside the hives in a box, then wrote a small program that retrieves the data from the bluetooth LE advertisements coming from both the scale and the temperature sensor, then fed that data back into the same database we use for the first scale we set up.
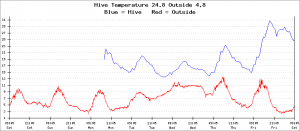
I wanted to get a good evaluation of the unit in action, so it’s under a hive right beside the existing scale hive, and I’ve put live graphs from this one together with the original on this website. Looking at the data now that it’s been collecting for a while, I think this unit is very useable. It is by no means ‘perfect’ and it will take some effort in understanding to get ‘science grade’ data out of this one, but that’s really a minor detail. There is some temperature sensativity in the load cells apparent in the graphs, but it should not be difficult to account for, the scale includes a temperature sensor, so it’ll just be a task of getting the temperature co-efficients for those particular load cells. The preliminary graphs I have posted include both the left and right load cell readings, as well as the average of those two in 3 separate lines. The big spike a few days ago is another dump of snow that came down.
Preliminary graphs from the BroodMinder scale.

The theory behind this unit is fairly simple. If we have a scale under the back side of the hive, and a 2×4 pry under the front to keep it level, the scale should be registering roughly half of the hive weight. The theory is sound, and if you are just after accurate approximations of hive progress during a flow, the Broodminder scale ‘out of the box’ is more than sufficient. If you want science grade data from the unit, that too is fairly easy to accomplish, just buy two and use a second scale instead of a 2×4 pry under the other end of the hive, then add the two weights together. I haven’t started to investigate temperature corrections yet, but it shouldn’t be difficult. With temp corrections applied for the load cells, graphs from this unit should indeed be as smooth as they are from the original scale which does have temperature corrections applied to it’s data.
When we first set up the hive scale, the original intent was to get an accurate understanding of the flows in our new area after we bought this property and started turning it into Rozehaven Farm. For that purpose, getting to understand the specifics of flows in any given location, this scale is more than adaquate. We track the dates when we see various blooms, and correlate that with data from the scale. This data set allows us to better understand which blooms produce the nectar that turns into honey in our colonies. When we first moved here, the mantra on this part of the island was ‘blackberries are the main flow’. Today, I dont agree with that older mantra, and we have hard data to back it up. Over 3 years of data collection, our hives on the lot here have never gained any significant weight over the blackberry flow. The early honey comes from the series of blooms that preceed the blackberry bloom, and in our case, the start of the blackberry bloom is now our cue to remove honey supers and extract the early honey. We take the time after pulling supers to prepare our colonies for the move up to Fireweed.
For somebody interested in honey production, I think the Broodminder scale can be an invaluable asset in evaluating yard locations. It’s fully self contained and requires no outside infrastructure to use. Simply place a colony at a new location, set the Broodminder scale under it, then collect your data later using your phone. You will get a nice pretty graph showing exactly when the colony was bringing in enough surplus nectar to store it as honey. We are considering a couple of new outyards as we slowly expand our bee operation, and I think those locations will get a colony this summer that is sitting on a Broodminder scale to give us a detailed record of how well each location can do in terms of honey production over the season, and help us with learning to better time hive placement for catching flows.
So it’s been an interesting season with regards to using a hive scale to monitor the bees this year. We haven’t learned much about the bees, but, we have learned a lot about snowloads. As it turns out, a scale hive is a fantastic way to understand the snowloads on your buildings. When we had the huge dump of snow in February, I was concerned about snowloads and trying to figure out if we needed to shovel some roofs. After some thought, I realized, the scale under the hive can answer that question quite handily. The telescoping cover is about 2.25 square feet, and it the scale showed a weight increase of just over 90lb thru that blizzard, so just under 40lb per square foot of snowload. This was well under the loads required by building code, so I relaxed with respect to shovelling the roof.
It’s Feb 26, records from prior years show we should be well into the spring bloom cycle. Well, maybe not this time, this morning there is another dump of snow sitting on the ground. It’s only about 10cm this time, but it’s a much heavier and wetter snow. The scale shows that there is roughly 11lb of snow sitting on top of the scale hive this morning.
I’m done with this now, I’ve had enough of winter, spring can come any time, we would be quite happy to be rid of this white stuff and see blooms starting, and I’m sure our bees feel the same way about it.
We had problems with the original broodminder unit set into the hive on the scale last fall, the issue was batteries going dead in a couple of days. The weather turned cold and I stopped trying to deal with that problem, we had reached the time of year where we dont want to open hives anymore, bees have the propolis seals in place for winter and I dont want to break those seals at that time of the year.
Earlier this week we had some nice weather, and on Monday we got out to do the first spring look at the bees. We popped the lids off of all of them, put on the first round of spring supplements, and while we had the lid off of the scale hive, I replaced the temperature and humidity sensor. So far, the replacement seems to be working much better, battery levels are reporting consistently in range of 87%. By Thursday the snow had melted enough I could get the lawn tractor into the back lot, so we took the chance to do a round of oxalic acid vapor to try knock down the mite population before the spring brood starts in earnest.
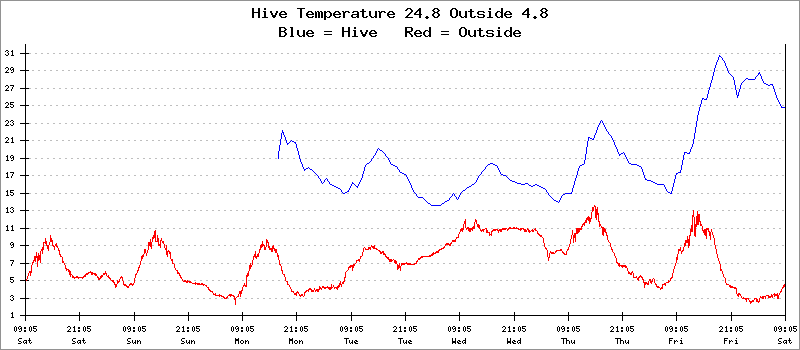
When we fed the bees, the pollen supplement went directly over the cluster and the temperature sensor right beside the supplement. I watched the graphs for a couple days, and the data looks good this time around, consistent measurements. The Broodminder is set to take a reading hourly, and it is providing temperature updates every 58 minutes like clockwork. The data proved to be very interesting, with definite patterns. The sensor went in on Monday, and thu till Friday we can see that the internal hive temperature is slightly above outside temps, and goes up and down with the ambient temp. On Friday this changed. Through the day on Friday the internal temperature went from around 15c strait up to 30c, which is approaching brood incubation temperatures, and it did not take the big drop overnight like we see on previous nights.
We normally see brood starting in early February, this winter has been much colder than years gone past, with hives buried in snow last week. But the internal temperature is fairly definitive this morning, the bees have started to incubate brood. The 2017 bee season has begun in Campbell River.
The question to ponder this morning. We put supplement on the bees on Monday, they have started to incubate brood by Friday. Is this a cause and effect relationship, or, is it just the normal time of year for them to start brooding ?
As an aside, the hive weight graphs are a bit skewed right now, but we did learn something interesting in the process. Last week the snow just dumped on us, it just kept on falling. At the peak, scale showed there was almost 80lb of snow sitting on top of a beehive. On the bright side, nature’s snowplow (rain) made it go away as fast as it came. There is a dramatic weight loss on the hive scale on Monday morning, that came about as we swept the remaining snow off the covers when lifting lids to check the bees. It was a nice warm day, the bees were flying, and we saw endless yellow spots on the snow as the bees got out to relieve themselves. That was a sure sign the bee season is about to begin, and the sudden increase in brood nest temperature is a confirmation, bee season has started.
We’ve had a hive on a scale now for 3 seasons, and have learned a LOT from that data. I have many times pondered putting more sensors into and on the hive, just to see what else there is to learn. The only reason it hasn’t been done, I just dont have the time and patience to sit down and wire up a bunch of things onto an arduino in a way that will stand up to the rigors of living in a beehive. The folks at broodminder.com have solved part of that problem for me, they produce a set of gadgets meant to be used in and under hives, and altho on the surface it may look a bit expensive, in reality, when I tally up my raw cost for purchasing the bits needed to make one, then the time and effort required to get it going, my final choice is just order it and get collecting data instead of pondering how to get more sensors into the hive.

I ordered two of the temperature and humidity gadgets, one to put in the scale hive, and one to use intially in the office for getting all of our software running, then later it can go in another hive. While I was at it, I ordered one of the scales. The scale will be sitting in a temperature exposed, but rain protected spot for a few weeks where I can log some data over time and figure out temperature compensation for this one, then stick it under another hive.
In the week since I got the Broodminder gadgets, I whipped up a small program that can run on a raspberry pi to read the bluetooth le advertisements produced by the gadget. With that program up and running, we added a bit more so the data will get stored into a database over the network as the new readings arrive, and we can plot the live graphs for hive temperature the same way we do for hive weights. This is all in place now, and we have almost a full day of measurements. On the scale hive page you will notice a new graph has been added, hive temperature vs outside temperature.

My starting point was to put the Broodminder-TH on top of the frames in the top box of the hive currently on the scale. The hive configuration for winter is a double deep with the top box full of winter feed for the bees, cluster is currently in the bottom box, a fairly large cluster. What was very interesting to note, the day I put it in was a nice warm day, around 14C in the bee yard, bees flying everywhere. When I lifted the lid, lots of bees on top of the frames in that box, temperature was around 30C, what I expect for a probe just above a brood nest. Two days later, after we had a very cold overnight (frost on the car window in the morning), I went out and pulled the data from the broodminder, and to my horror, the broodminder was reading 14C for temperature. Did they die off that quickly ? And this turned into a big ‘aha’ moment for me, very similar to some of the ‘aha’ moments we’ve taken from the scale data.
This colony is in a double deep, with the cluster in the bottom box, and above the cluster is a full box of stored honey. The frames of honey above the cluster are one great big heat sink, so any heat rising off the cluster is being absorbed by the frames of honey before it reaches the temp sensor at the top of the hive. The interesting tidbit I take from this, over the years I’ve heard the debate, do bees heat the whole box, or just the cluster. Some folks say ‘just the cluster’, others point to snow melt on a lid and are adamant they heat the whole box because warm air rises. Well the light bulb turned on when I saw this, and now I better understand the dynamics of heat flow in the hive. Warm air will rise off the cluster, but, any frames of honey will act as a big heat sink as that air rises to the top of the box, and, by the time it reaches the top, it’ll be a lot cooler than when it rose off the cluster.
It will be interesting to watch this as winter progresses, and get a better understanding of what’s happening inside the colony thru the winter. The biggest detail I expect to learn, we will see the temperature at this probe just under the inner cover start to rise dramatically after the bees have moved up into the top box, and start the first round of brood in the winter. I have LONG suspected that our bees raise the first brood a lot earlier than we have been told over the years. Having this probe giving us temperature and humidity measurements from inside the box will answer my questions in this area quite definitively.
This has been the week of new toys around the farm. The week started with arrival of the shiny new JB700 oxalic acid blower, which should make the job of hitting the mites with Oxalic Acid Vapors a LOT faster. Using the older pan style vaporizer, it takes roughly 4 minutes per colony to do a round of oxalic treatments. After placing the pan into the hive entrance and blocking it, the unit has to be powered for a minute and a half to get up to temperature, then left in place for another minute to finish vaporizing. Add another minute and a half to take it out, reload, and prepare the next colony, works out to 4 minutes per hive.
With the new JB700, things change a bit, no, a lot. A single load of Oxalic in this vaporizer will do 4 hives, and it’ll do them in under 2 minutes. You fill the pan in the vaporizer with the OA, turn it on, and about 30 seconds later the acid starts to sublimate. Turn on the fan and stick the nozzle into the entrance of the first hive. When you see the vapor coming out of the cracks at the top, move on to the next one.
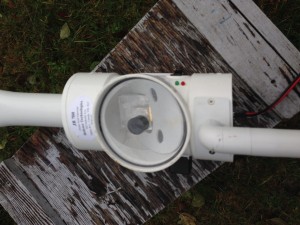
Wow. I took this shot 2 minutes after I vaporized the hives with the new JB700. If I had any doubt about enough OA in the colonies from a blast out of this thing, I dont anymore.
On my first outing, I did all of our colones (currently 18 of them) in 20 minutes, but half of that time was spent testing the new toy and getting to understand how it works. I ran one load of OA thru from start to finish with it just sitting on top of a hive to get a feel for how much vapor comes out of this gadget. This video shows the result. Do watch to the end when I walk around and take show the cloud of OA vapour drifting across the bee yard.
JB700 in action
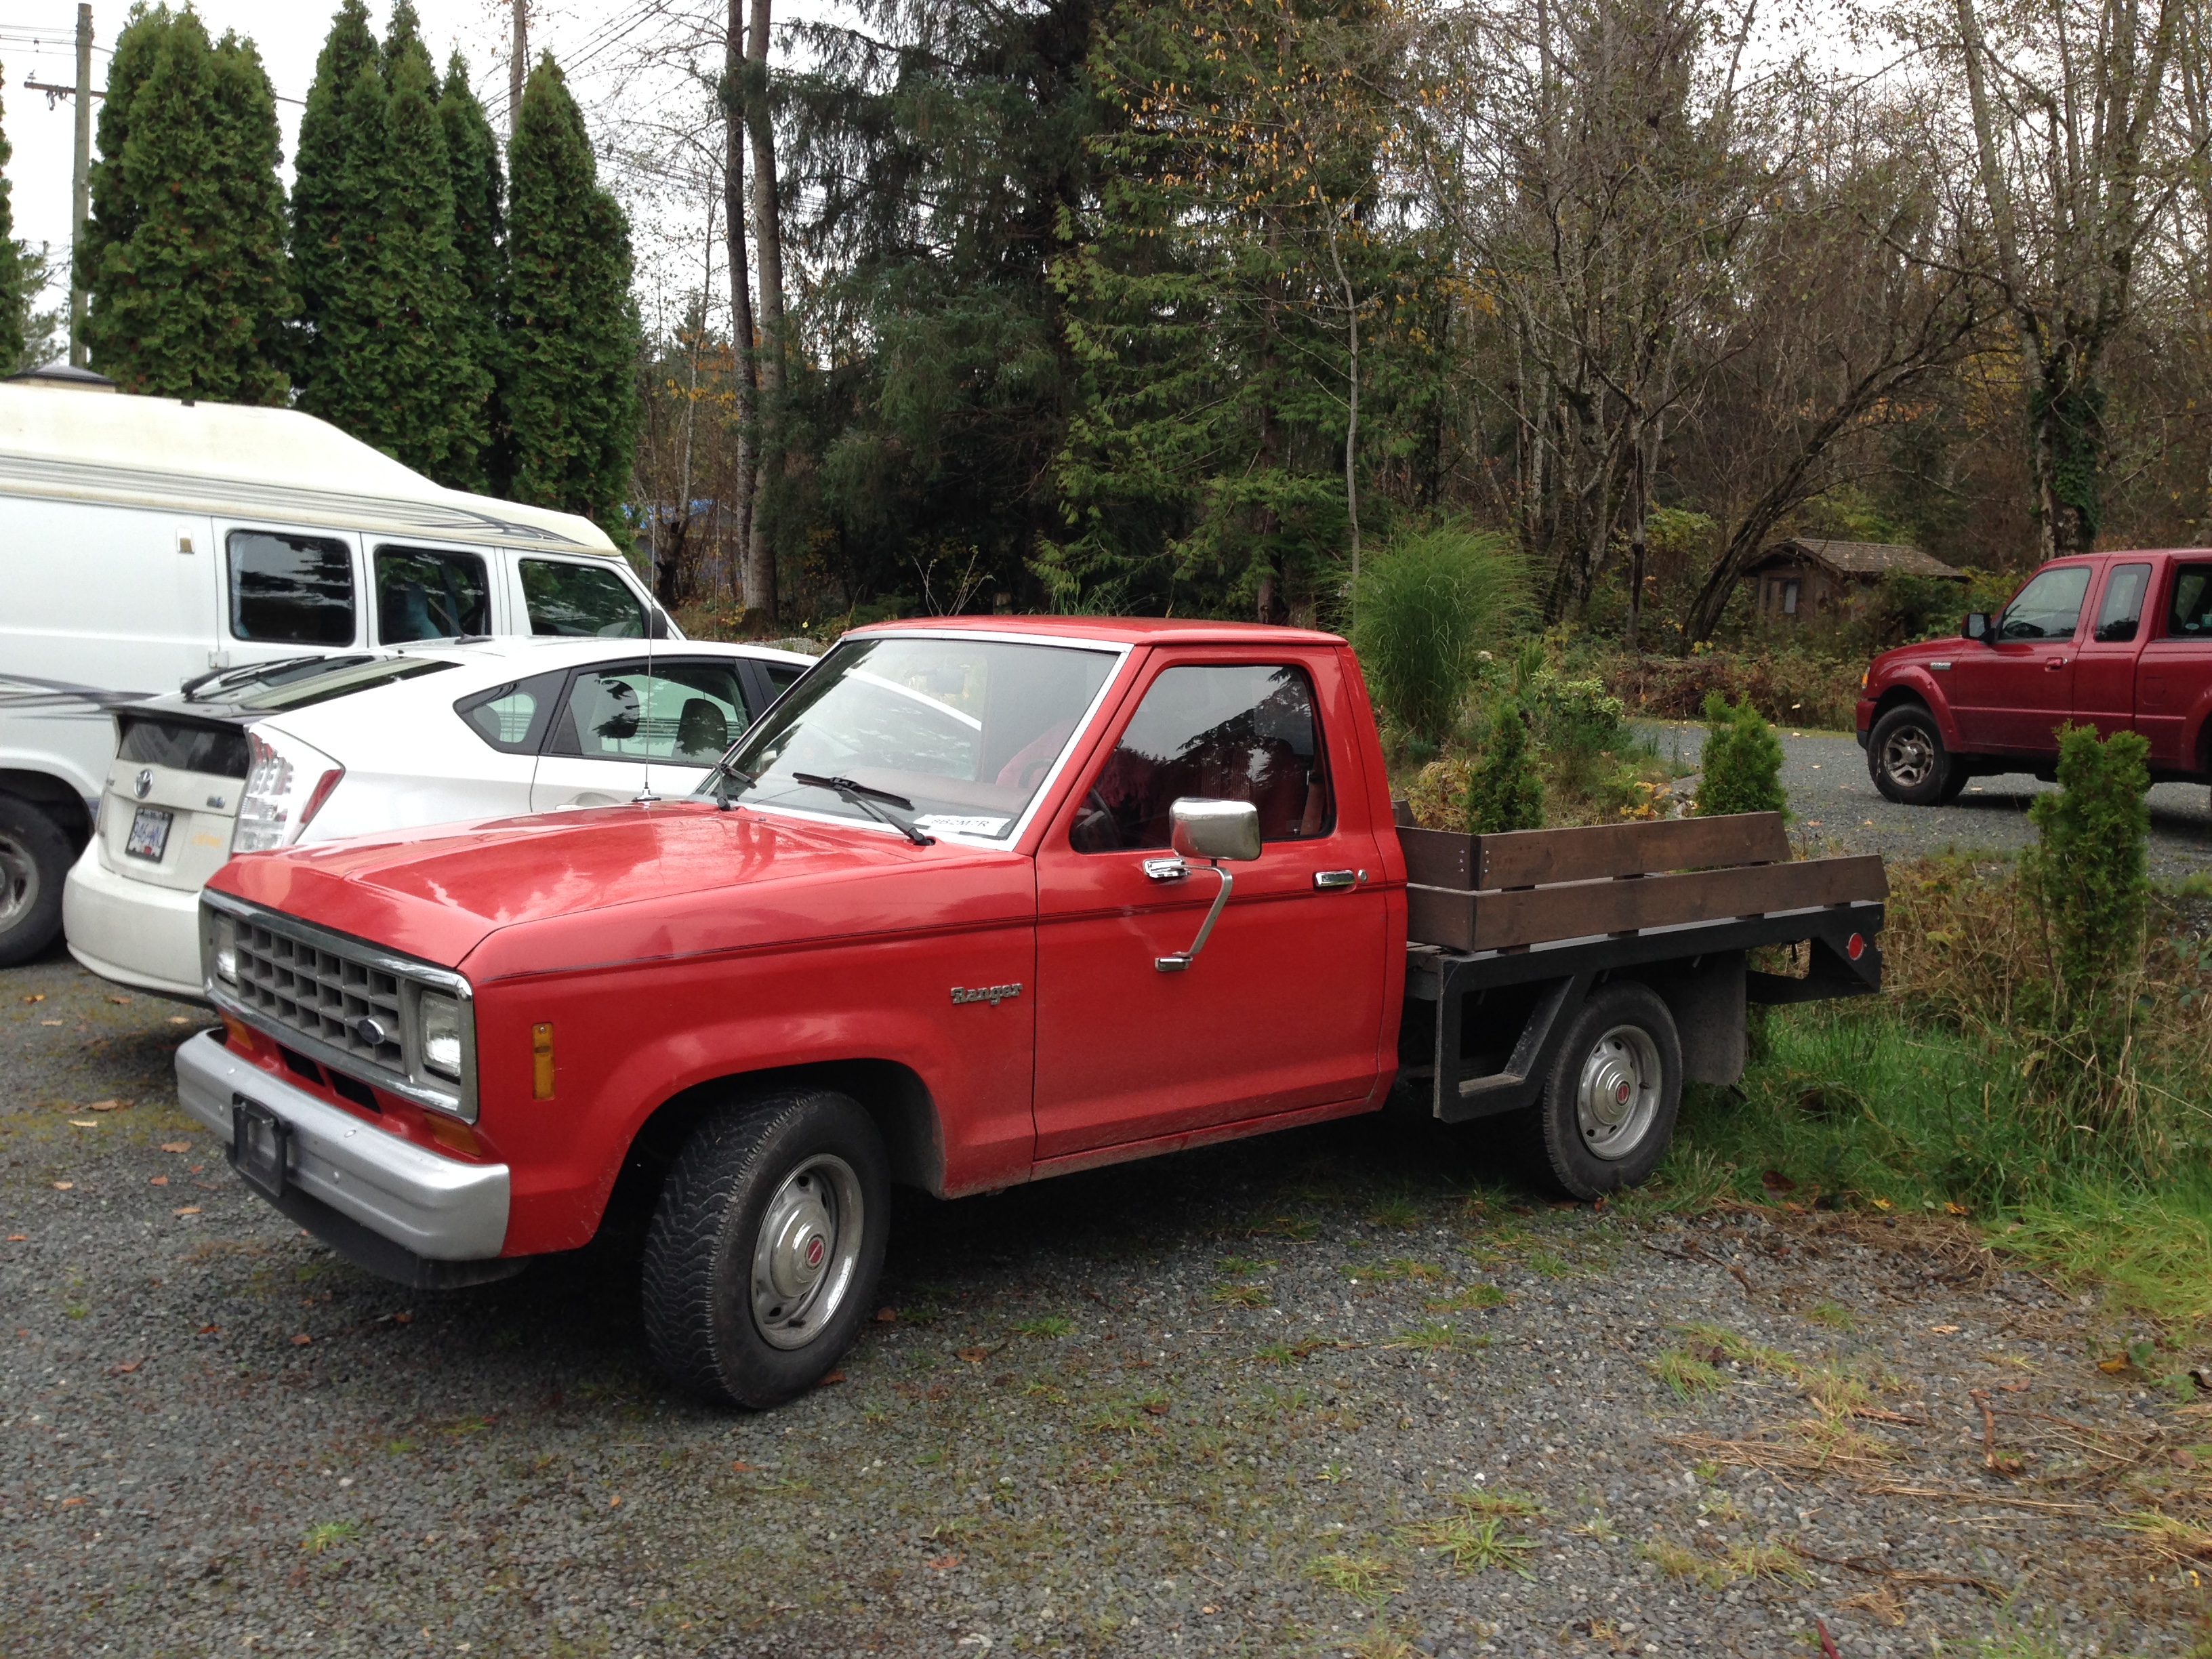
If that wasn’t enough new toys for the week, this weekend another one showed up on Sunday afternoon.

I think this will certainly change how we do a lot of things around here. The small flat deck will be more useful than a regular pick up box and is very convenient for hauling bee hives around.
Varroa has been an ongoing issue for us over the years, but, in most years we have managed successfully, more by accident than by design. 2015 was the exception, and late in the season that year we had a number of hives experience the classic ‘varroa crash’ during August. This inspired me to learn a lot more about this pest in hopes of better managing it in the future.
In years gone past, I always tended to think of varroa populations in terms of bee brood cycles, and in my mind I roughly considered varroa to double over the 3 week interval which is a worker brood cycle. Reading and learning about this pest showed me that was a very serious mistake in understanding this pest. After reading many papers, and lot of online information, I digested it all into my own ‘simple’ form which is essentially a distilled version of everything I have read about this pest. During the bee brood season, the varroa life cycle runs two distinctly different phases, as the math below will show. Using averages which come from lots of different sources, the short form of the active life cycle boils down to a few basic numbers. A fertile varroa mite has an average life expectancy of 27 days during the summer season when bees are brooding. Like the bees, they live much longer when the colony is broodless and they are in ‘winter survival’ mode, but we will ignore that phase for this discussion, and focus on varroa populations during our active work bee season.
The female varroa mite will enter a cell shortly before it is capped, and does her reproductive magic under the capping with the developing bee brood. For a worker cell, the capped phase is 11 days, and during that time the female will produce one male offspring, and averages say something like 1.5 females. We all know that 1.5 offspring is not possible, so it really means some of them manage 1, and some of them manage to produce 2. For the sake of keeping our math simple, and estimating conservatively, we will just consider the case of 1 offspring produced. So in the typical cell, when the bee emerges, we will have 2 viable mites emerge from a worker cell, then spend approximately 4.5 days as phoretic mites before they once again enter a cell to reproduce. These numbers tell us, the reproduction cycle of the varroa mite runs at 15 days. Now follow thru what happens on the next round. Both of these fertile mites will once again reproduce and create one new fertile female each, to emerge with the developing worker bee. At the end of this cycle, we have 4 mites emerging, but, the original foundress mite is now reaching the end of her lifespan, and dies. So the net result is this, with one fertile mite at the start of the cycle, we go thru two full reproductive mite cycles which takes 30 days in total, and we end up with 3 viable mites in the colony. With only worker brood present, we expect the mite population to triple every 30 days.
The math changes when we have drone brood present, the mites will prefer the drone brood to reproduce if it’s present. So now follow the same cycle, but this time for drone brood. After spending the 4 days in phoretic phase of life, the female enters a drone cell which will be capped for 14 days. Literature suggests that the average offspring in drone brood with 14 days under capping will be something like 2.5, but again, we know you cant produce half a mite, so we will just look at the round numbers, assume she is producing 2 viable offspring. They emerge when the drone emerges 14 days later, and proceed to spend 4 days in the phoretic phase before entering cells to reproduce. On the second cycle we now have 3 viable mites entering cells, and all of them will produce 2 offspring, for a total of 9 mites emerging at the end of the cycle. One of those mites is the original foundress who has now reached end of life and dies, if she hasn’t already died in the cell. 14 days under the capping and 4 days phoretic gives us an 18 day reproduction cycle, and with one mite at the beginning of the cycle, after two cycles (36 days) we have 8 viable mites in the colony. An increase by a factor of 8 over 36 days is equivalent to doubling over 12 days.
Armed with this understanding of the mite reproduction cycle, lets look carefully at one bee season in the Comox Valley, or more specifically on our little farm here south of Campbell River. Our records show that we see hazelnut pollen typically around Feb 10, and checking on our bees shows that they are indeed starting a round of brood at that time, and have been every year we have been here, so, Feb 10 is the start of our season. Now lets follow the math for one colony that enters the season with one, and only one, viable mite ready to enter a brood cell on Feb 10.
In the early season, we have only worker brood, so the mite population will triple over a 30 day period. One mite on Feb 10 will result in 3 viable mites 30 days later, March 12. Another two mite breeding cycles takes us to April 10, and we now have 9 mites in the colony, but things are changing. On April 10 we will have drone brood available for the mites to breed in, so, instead of tripling over 30 days, we now reach the time of the season where mites can double every 12 days on average. By April 22 our 9 mites becomes 18, then May 4 we are up to 36. May 16 the number is 72, and reaches 144 by May 28. By 9th of June that number is up to 288, then 576 by June 21, the mid summer solstice. Assume we do a count of our mites at this time via a sugar roll or wash, bee population will be up near 50,000 bees, and there are just over 500 mites in the colony, our wash numbers say 1%, and everybody is happy, we are well below the ‘economic threshold’ for mites. or are we ??????
Continue now thru mite breeding cycles and watch the numbers. With 576 in the colony on June 21, that becomes 1152 mites by the July 1 weekend, we are now at 2% infestation on July 3. By July 15, that number doubles again, and we now have 2304 mites in the colony, and the number climbs to above 4500 by July 27, and north of 9000 by August 8 for an 18% mite load. At this point, things will start to deteriorate rapidly for a number of reasons. First off, we have a mite on 1 out of 5 bees, but since mites prefer to stick with the nurse bees in the brood nest area, it’s more like one on every second bee in the brood nest, so we will be getting very unhealthy brood at this point, most of which will have mites in the cells, and to really compound this problem, it’s a time of year when the bees are contracting the brood nest and starting to think about raising winter bees.
All I can say to this after working thru the numbers is WOW, now I understand why the ‘typical mite crash’ happens thru the month of August, mites left unchecked at that point are growing in numbers exponentially over 12 day periods. But armed with knowledge, now we can start to think about how to better address this problem. One thing I learned from two decades in aviation, accidents dont just happen, they usually come about from a chain of small things that add up to one big thing, and the key to aviation safety is break that chain early in the process. This is why we developed systems of checklists, so we dont end up in the situation where one small item forgotten early in the process cascades to the big event farther down the chain. We can take the same attitude to our bees and mites, and just look at the chain of events of population doubling over various periods.
If I home in on the timeframes where drone brood is present in the hive, what really stands out is this. One mite we eliminate today, is 8 mites we wont have in 36 days, which becomes 64 we wont have in 72 days, ie 10 weeks down the road. Expand this by one more cycle of 36 days, and it’s 512 mites we will not have 108 days (15 weeks) down the road. So now if I do some calendar math, we see hives crashing from mites in the early August timeframe. Every mite we remove from a colony on May 1 is potentially 500 mites we will not see on August 15.
Doing the math on mite life cycles was an enlightening experience for me, it fully explained some of the things I’ve seen in the field, and more importantly, shows me the importance of mite control early in the season. If I do a sugar roll to count mites in May and find one, and only one mite on 300 bees, the typical thought train is that load is light enough to ignore. On average roughly 20% of the mites are going to be phoretic at any time, the rest are hiding under cappings with brood, so my population at that time is indeed 5 mites per 300 bees, about 1.5% which is a number we have always been told to be under the ‘economic threshold’ for mites. But left totally unchecked, that population is more than enough to grow exponentially thru the season and kill the colony by August. A sugar roll or wash count of 2 mites on May 1 left unchecked results in a dead hive in August.
The other really important detail I took from this exercise is looking at the phoretic phase, and the phase of mites in the cells under cappings. If we do an intervention that only gets phoretic mites today, after measuring a population of 1% with drones brood in the hive, then come back 12 days later and check again, the colony will look like we didn’t do anything, and measure roughly 2% infestation. An intervention that only gets phoretic mites will NOT show up in counts until _at least_ 18 days later, when the mite brood that would have been from those mites would start to emerge. In the meantime, all of those mites that were hiding under cappings will continue to emerge over that period. Reality is, if I do an intervention on July 1 of a type that only affects phoretic mites, by July 5 I would expect to see a 25% increase in the population when I check due to all the mites that emerged in the 5 days between intervention and testing. If I do a single intervention on July 1 that effectively eliminates phoretic mites, I dont expect to see a decline in numbers before July 20, and in the intervening 3 weeks, the numbers will continue to skyrocket upwards, so much so that by July 20 the effect will hardly be noticeable anyways. If all the mites were specific and jumping into cells exactly 4 days after emerging, we would see the noticeable difference around July 20, but, the 4.5 days phoretic is only and average, so by 20 days down the road the decrease will disappear in the averages.
There is lots of food for thought to ponder in all of this, but, this exercise of doing some simple math on the mite reproduction schedule has been enlightening for me, and has me seriously re-thinking mite strategies. My biggest takeaway from it all is, low counts early in the season are a leading indicator for hives crashing in August, not an indicator telling me ‘good enough’.
Every spring at the bee club meetings the question asked by new beekeepers is ‘When is the swarm season?’. One answer given regularly by some of the old timers is this.
Swarm season begins when you see the first blossom on the apple trees, and is over when you eat the first raspberry.
It sounds like a reasonable answer, so we took note of a post from the Ocean Grove raspberry farm the day before yesterday, it mentioned eating the first ripe raspberry. The first thought is, yay, swarm season is over. Well, like always, the bees dont read that book, and sure enough, the very next day at 4:30pm the phone rings. There is a swarm of honeybees in town in a tree hanging over a well traveled sidewalk. So drop everything and off we go to collect a swarm of bees that has landed in a very inconvenient spot for one local business.
The bees were polite enough in this case to cluster on a branch only 8 feet off the ground, easily reached with the hose on the bee vac. I vacuumed them into the swarm collection box and brought them home. When they first went into the new box to be the new home, it didn’t look like they wanted to stay, and a fairly large cluster was starting to form on the outside of the box, so I added a frame of open brood from another hive. After about 15 minutes they had moved inside. Later in the evening, I wanted to confirm the swarm had a queen so opened it up again and started looking over the frames hunting for a queen, expecting it to be a difficult one to find because she would be slimmed down for flight before the swarm. She would have been difficult to spot, except thw big blue dot on her thorax made it trivially simple to confirm there is a queen in there with the rest of the swarm.
So for folks looking at the scale data recently, you will notice the scale hive has been offline for a few days. It’s an artifact of using an off the shelf scale that requires it be started with no weight on to set a new zero point after it’s been turned off. We had a power outage that turned off the scale, and I was out of town for a few days, so didn’t get it reset until this weekend. I put a short term solution for this kind of problem in place over the weekend, the scale now has a small ups to provide power thru short term power outages.
This is my biggest gripe with using an off the shelf electronic scale, all of the ones I’ve looked at suffer from this issue. When first powered up, they want to set a zero point, so you need to offload the hive when powering up the scale which is a royal PITA at times. Once it’s up and running, reading zero, then you put the hive back down on the scale. The ups is a band-aid type solution, at least it means the scale wont reset over a short term power outage, but a proper solution would be a scale that can be powered up with the load already in place. I haven’t found this one yet, but, still searching.
 Some time later, we removed the frame from the hive and took a photo.
 A quick measurement of how much comb we found in the empty space, and how much was on the plastic foundation gave me the answer I was looking for, and that answer was, no appreciable difference between the two halves of this frame, placed in this hive.
This last weekend we attended the BCHPA annual meeting and the associated education days. One of the sessions I sat in on was a presentation by Randy Oliver describing the correct way to go about a real ‘experiment’ and produce acceptable valid conclusions. My simple comb building experiment was essentially ‘all wrong’, about the only thing right with this one, indeed there was a test case, and a control, subject to identical conditions. That part was easy, the test and control were both on the same frame, placed in the same hive. the result isn’t truely valid because we had only one frame in one hive, so, no other hives replicating this result, and N=1 is not a valid statistical answer. But I also learned, this would be a relatively strait forward experiment to repeat, but, in a more formal manner to produce a result that would be accepted as a real ‘practical research result’.
For those that know me, they know I am big on doing applied research to get practical results that have implications for our business. Next season, during the main flow, we will have more than enough colonies building in 4 over 4 nucleus configurations to repeat this experiment in a manner that can generate a statistically significant result.
The question we asked before, will bees build more comb in a foundationless frame than on a frame with plastic foundation? Randy would say, the correct answer is ‘I dont know’, because we dont have data to show a definitive answer. I have _some_ data, but not enough to be definitive, so I’ll qualify my answer as ‘I dont think so’, but now I’m a bit inspired to produce a real answer, and this is a real answer that’s easily within reach. I’ve got 6 months to write up a proper experiment protocol which can be executed next season during our spring flow, and produce a real answer to this question.
This is going to be fun….
A quick measurement of how much comb we found in the empty space, and how much was on the plastic foundation gave me the answer I was looking for, and that answer was, no appreciable difference between the two halves of this frame, placed in this hive.
This last weekend we attended the BCHPA annual meeting and the associated education days. One of the sessions I sat in on was a presentation by Randy Oliver describing the correct way to go about a real ‘experiment’ and produce acceptable valid conclusions. My simple comb building experiment was essentially ‘all wrong’, about the only thing right with this one, indeed there was a test case, and a control, subject to identical conditions. That part was easy, the test and control were both on the same frame, placed in the same hive. the result isn’t truely valid because we had only one frame in one hive, so, no other hives replicating this result, and N=1 is not a valid statistical answer. But I also learned, this would be a relatively strait forward experiment to repeat, but, in a more formal manner to produce a result that would be accepted as a real ‘practical research result’.
For those that know me, they know I am big on doing applied research to get practical results that have implications for our business. Next season, during the main flow, we will have more than enough colonies building in 4 over 4 nucleus configurations to repeat this experiment in a manner that can generate a statistically significant result.
The question we asked before, will bees build more comb in a foundationless frame than on a frame with plastic foundation? Randy would say, the correct answer is ‘I dont know’, because we dont have data to show a definitive answer. I have _some_ data, but not enough to be definitive, so I’ll qualify my answer as ‘I dont think so’, but now I’m a bit inspired to produce a real answer, and this is a real answer that’s easily within reach. I’ve got 6 months to write up a proper experiment protocol which can be executed next season during our spring flow, and produce a real answer to this question.
This is going to be fun….